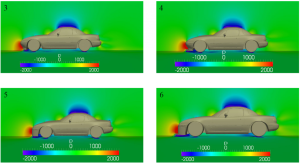
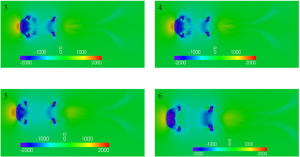
How do you choose which front end aerodynamic route you need to go? This is a tough question to answer so lets work through an example. The example will be a 1990-1997 Mazda Miata. The Miata was chosen simply because 1. I have the model and 2. because different designs are commonly used.

CFD Models
1. Stock 1990-1997 Mazda Miata
2. Stock 1990-1997 Mazda Miata at a 4in Ride Height
3. Small Front Air Dam at 4in Ride Height
4. Small Air Dam with Splitter at 4 in Ride Height
5. Large Air Dam at 4in Ride Height
6. Large Air Dam with Splitter at 4in Ride Height
Note: The air dam and/or splitter is 2 inches off the ground in study 3-6
The solver used for these analysis is a steady state incompressible solver with a k-omega SST turbulence model. Again OpenFOAM (as always) was used for pre-processing and solving and all post-processing was done using Paraview.

Cd = coefficient of drag
Cl = coefficient of lift
L/D = lift divided by drag / aerodynamic efficiency
Drag between all setups are all fairly close with the least drag being the setup with the large front splitter. The two splitter designs also makes significantly more downforce than the other setups. The two stock Miata setups makes lift instead of downforce which is expected since most road vehicles create lift from the factory.
Note: These are numbers and trends for common designs choices. Actual designs should be more refined after design goal is formulated.
The stock Miata simulation had a calculated coefficient of drag of 0.36. The 1990-1997 Mazda Miata had an indicated coefficient of drag of 0.38. The simulated Miata has a lower coefficient of drag; which was expected from the simplification of the vehicle. The simplification of the underside has an estimated coefficient of drag decrease of 0.015. That along with the simplified wheels and no internal flow, puts the coefficient of drag between the simulation and the indicated coefficient of drag within a reasonable error. This means the simulation passes the “sanity” check to ensure validity in the data.

XZ-Plane Velocity Cut Plot
Okay, now what does all this mean???
The main question is actually a trick question since there is not one “BEST” design. Different designs are all about compromising. First L/D and downforce goals should be known for best track times ***This is different with different tracks and cars*** The rear aero should be decided first and then the front design should balance the car back out.
-Paul


